TWGFD
The Tetraploid Wheat Gene Family Database
Overview of TWGFD
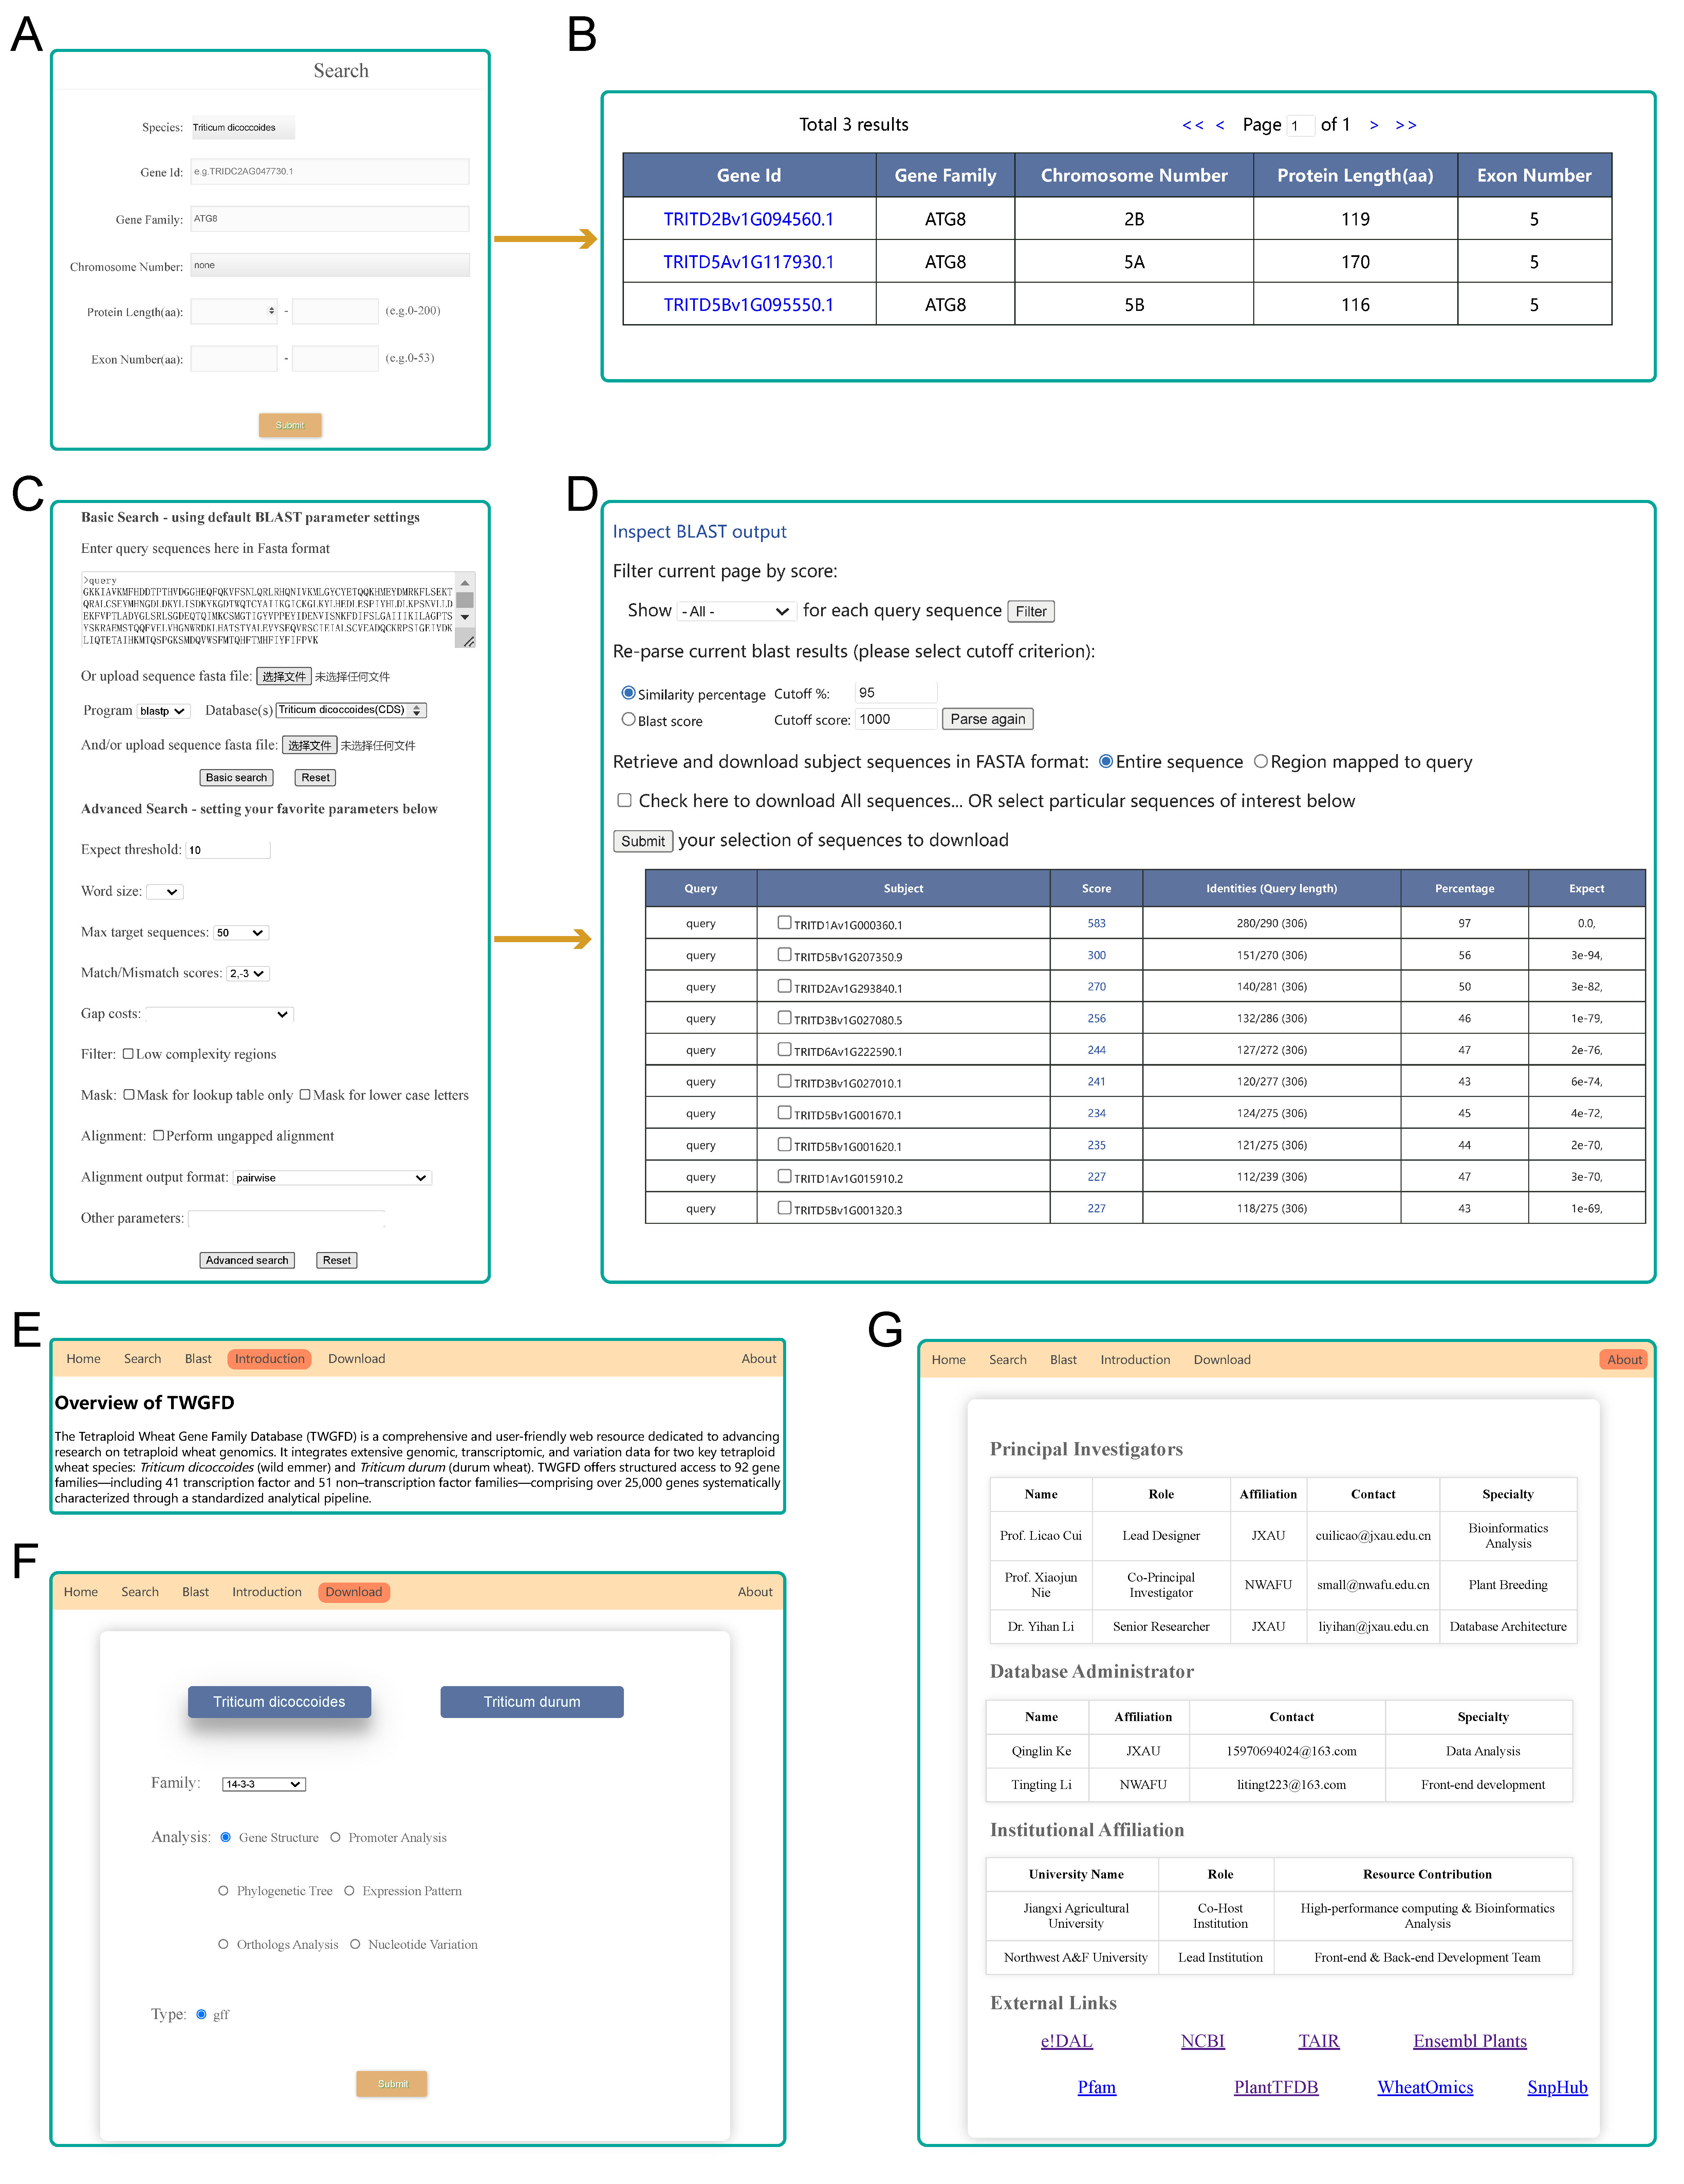
The Tetraploid Wheat Gene Family Database (TWGFD) is a comprehensive and user-friendly web resource dedicated to advancing research on tetraploid wheat genomics. It integrates extensive genomic, transcriptomic, and variation data for two key tetraploid wheat species: Triticum dicoccoides (wild emmer) and Triticum durum (durum wheat). TWGFD offers structured access to 92 gene families—including 41 transcription factor and 51 non–transcription factor families—comprising over 25,000 genes systematically characterized through a standardized analytical pipeline.
Construction Workflow
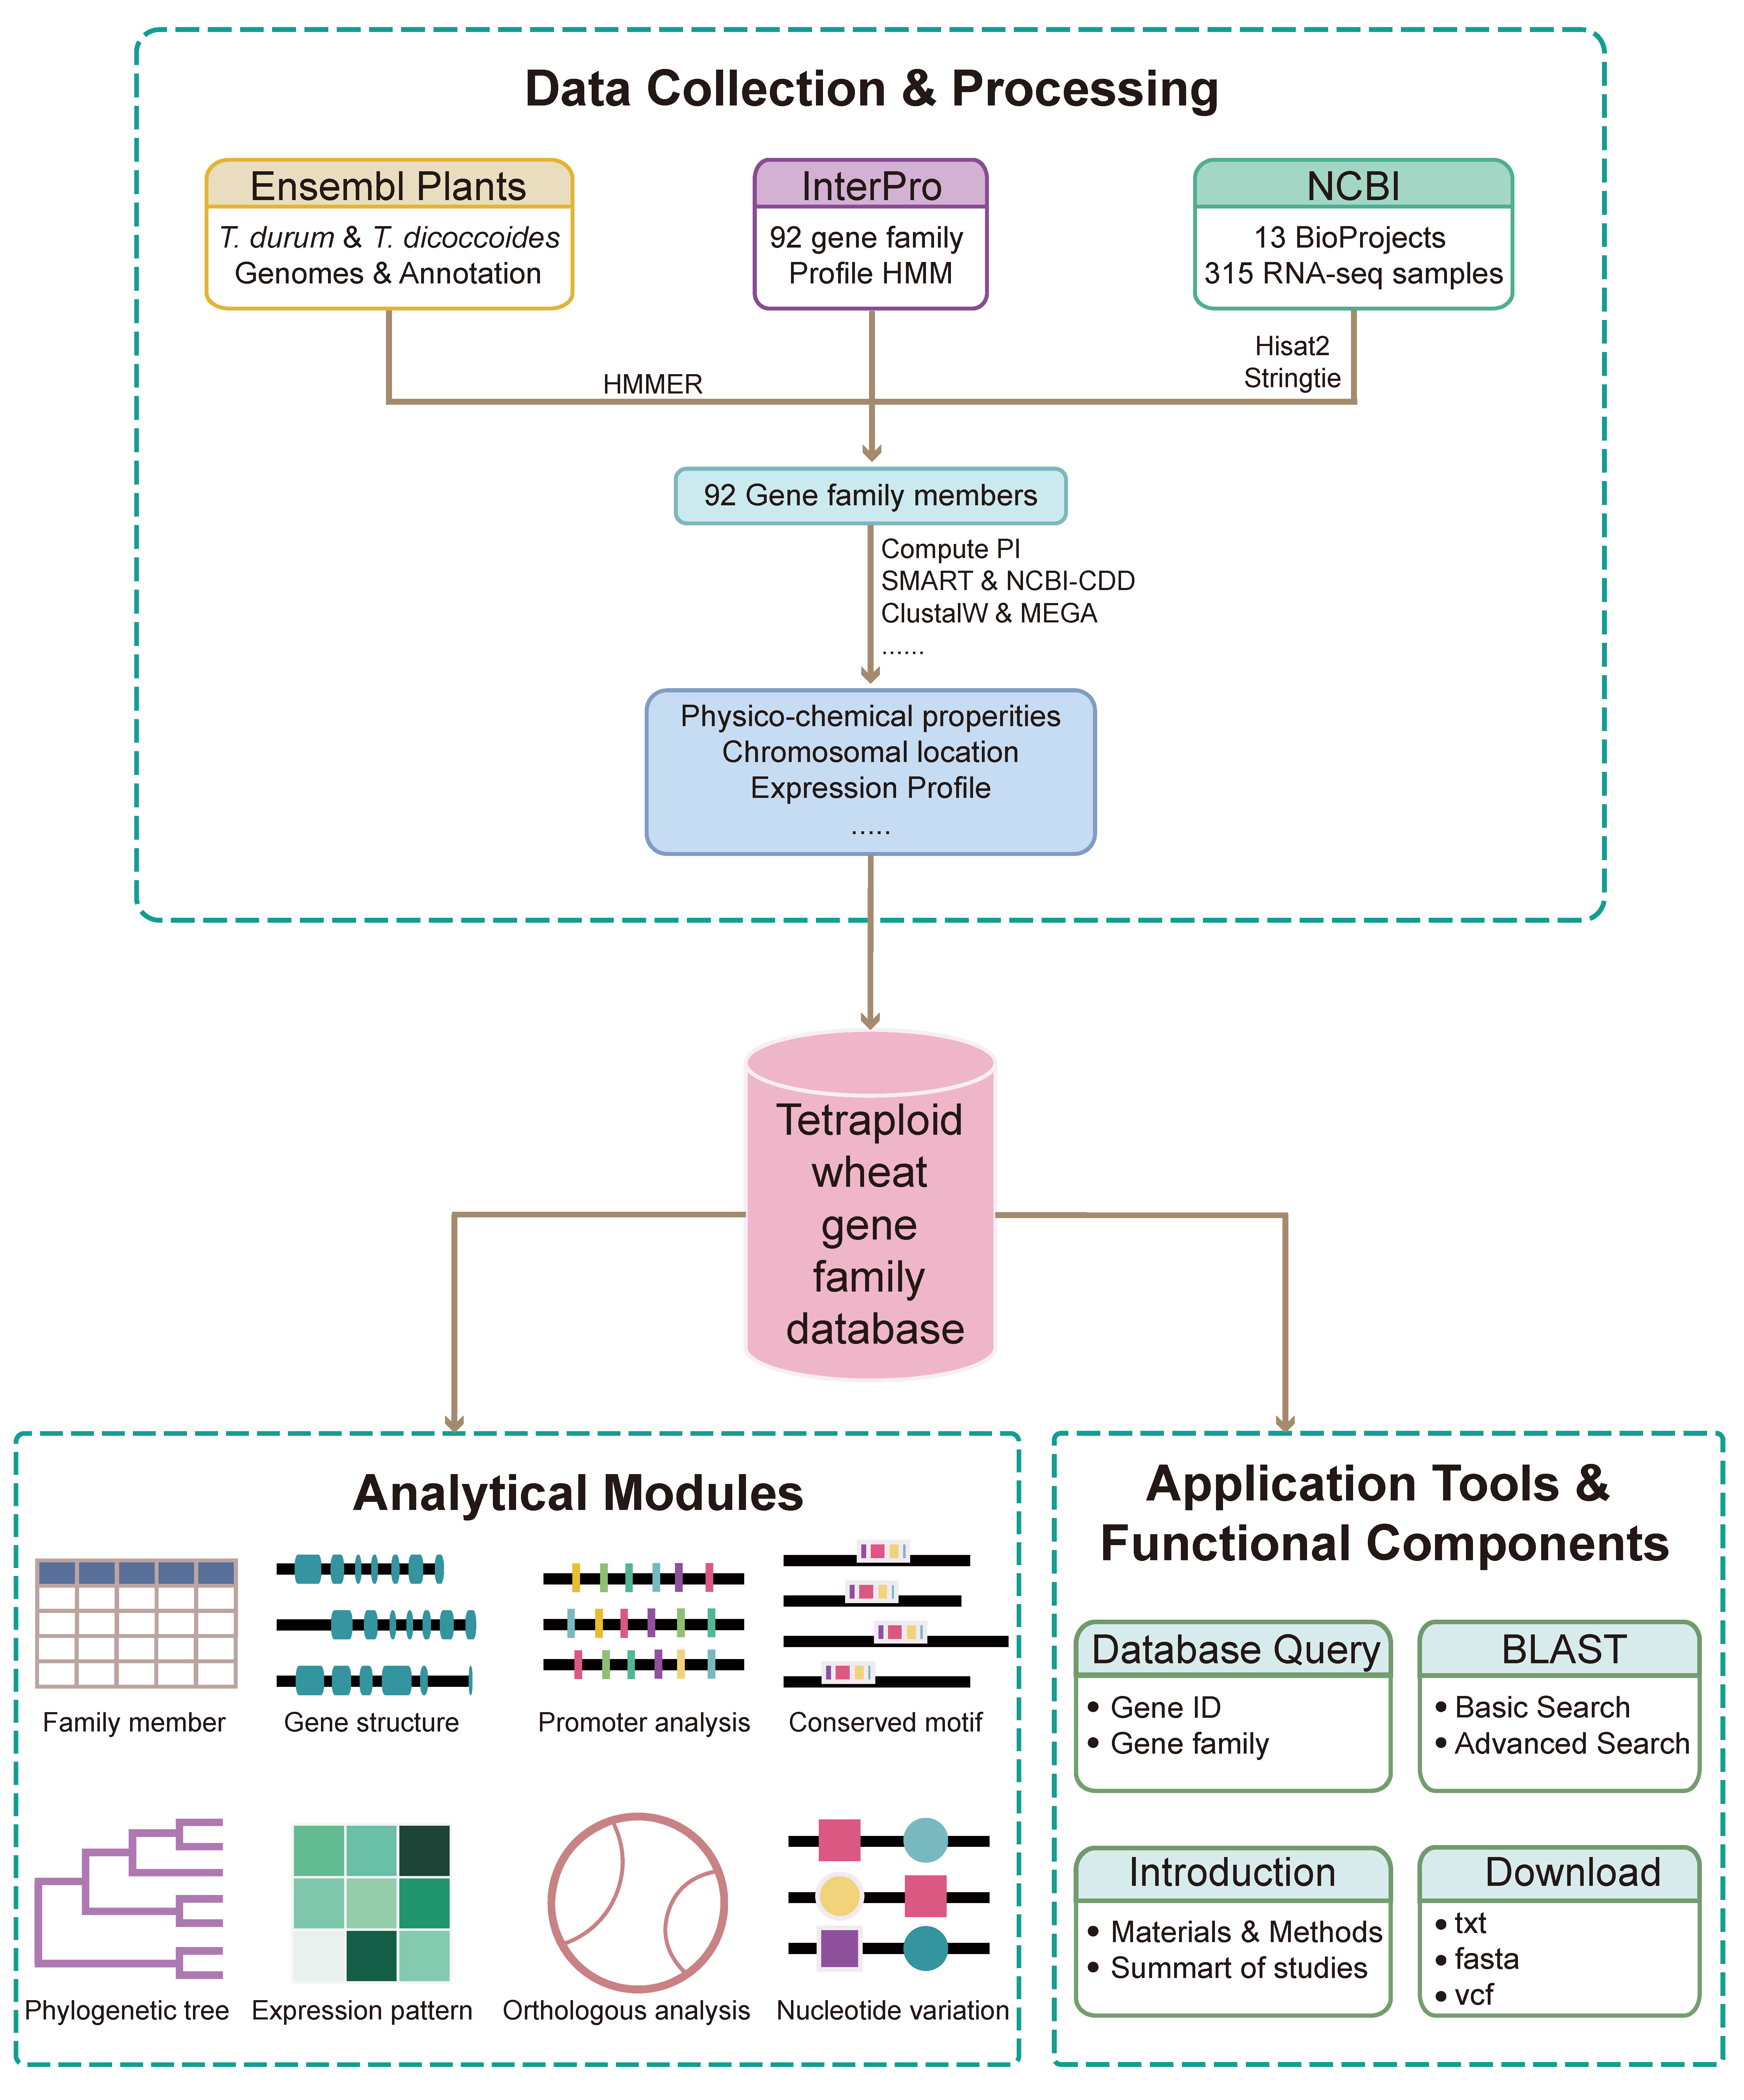
The Tetraploid Wheat Gene Family Database (TWGFD) was constructed through a systematic and integrated bioinformatics pipeline. The process involved:
Data Acquisition: Amino acid sequences of Triticum dicoccoidesand Triticum durumwere retrieved from Ensembl Plants, and protein domain models (HMMs) were obtained from Pfam.
Gene Family Identification: Candidate genes were identified using HMMER and validated through NCBI-CDD, SMART, and InterPro.
Physicochemical Characterization: Properties such as molecular weight, pI, and GRAVY were computed using ExPASy ProtParam.
Structural and Evolutionary Analysis: Gene structures, cis-regulatory elements, and conserved motifs were analyzed with GSDS, PlantCARE, and MEME. Phylogenetic trees were built using MEGA X, and evolutionary rates (Ka/Ks) were calculated via PAML.
Expression and Variation Integration: RNA-seq and resequencing data were processed and aligned to reference genomes. Expression values (FPKM) and SNP annotations were incorporated.
Database Deployment: The platform was developed using a Linux-based cloud server with Nginx, MySQL, and PHP, and enhanced with interactive front-end components.
This workflow ensures comprehensive integration of multi-omics data for efficient querying and analysis within TWGFD.

Fig. 1 Development pipeline of the TWGFD.
Database Modules
TWGFD is organized into eight interactive modules:
Gene Family Member: Lists genes with identifiers, locations, and sequences.
Conserved Motif: Displays protein motifs and consensus sequences.
Cis-acting Element: Annotates regulatory elements in promoters.
Phylogenetic Tree: Presents evolutionary relationships among genes.
Expression Pattern: Shows tissue-specific and stress-responsive expression profiles.
Orthologous Gene: Identifies cross-species orthologs and evolutionary constraints.
Nucleotide Variation: Provides SNP annotations and variant calls from resequencing data.

Fig. 2 The eight core functional modules of the TWGFD.
Key functionalities include an advanced BLAST tool for homology search, supporting five algorithm types against dedicated gene sets; a versatile Search system supporting gene ID and family queries; and a Download section offering various data formats for offline analysis.
TWGFD serves as a vital platform for researchers exploring gene family evolution, functional genomics, and molecular breeding in wheat.